| Offers: Light and Darkness · Simulation · Software · Company · Contact |
 | |

| |
Motivation
Our managing partner Lukas Schuler loves stargazing. However, that enjoyment has been impacted by light pollution since the eighties. By joining and actively supporting DarkSky Switzerland, an organization aiming at reducing light pollution, he finally found progress in the right direction. However, still feeling things moved forward too slowly, he started his own research with available sources documenting nightly light emissions.
With this scientific evaluation of insight and methods, we are now
able to offer data analysis for public and private parties. |
Understanding Magnitude and Changes in Light Emission Locally
At first glance, the nightly image of Earth with its artifical light looks fascinating like fireworks. If you zoom in, however, you realize how much light is flooding from towns into the landscape.
Analysis of municipal light emissions from data of environmental satellites
Monitoring by satellites has several advantages for regional analysis:

- Comparison to neighbouring municipalities is possible due to nearly global availabilty of data
- Data comes pre-processed with error correction and artifact removal
- Stability of data enables averaging over several months, seasons or years
- Measurements and data sources are fully independent and unbiased
The available resolution does usually not suffice to identify individual light sources, but serves well as an overview of the real situation. We establish further clarity through comparisons.
The results are presented in
a report
along with maps, charts, commentary and suggestions for action.
Example: Municipality Hägglingen, Switzerland
Standings Spring 2018
The map displays the municipaly in the centre in colour (brown/orange), while the neighbouring municipalities use grayscale with the same lightness. The scale grading refers to the illumination equivalent of the full moon, which makes it easy to grasp intuitively. The bright placess can be spotted readily and compared to the surrounding areas.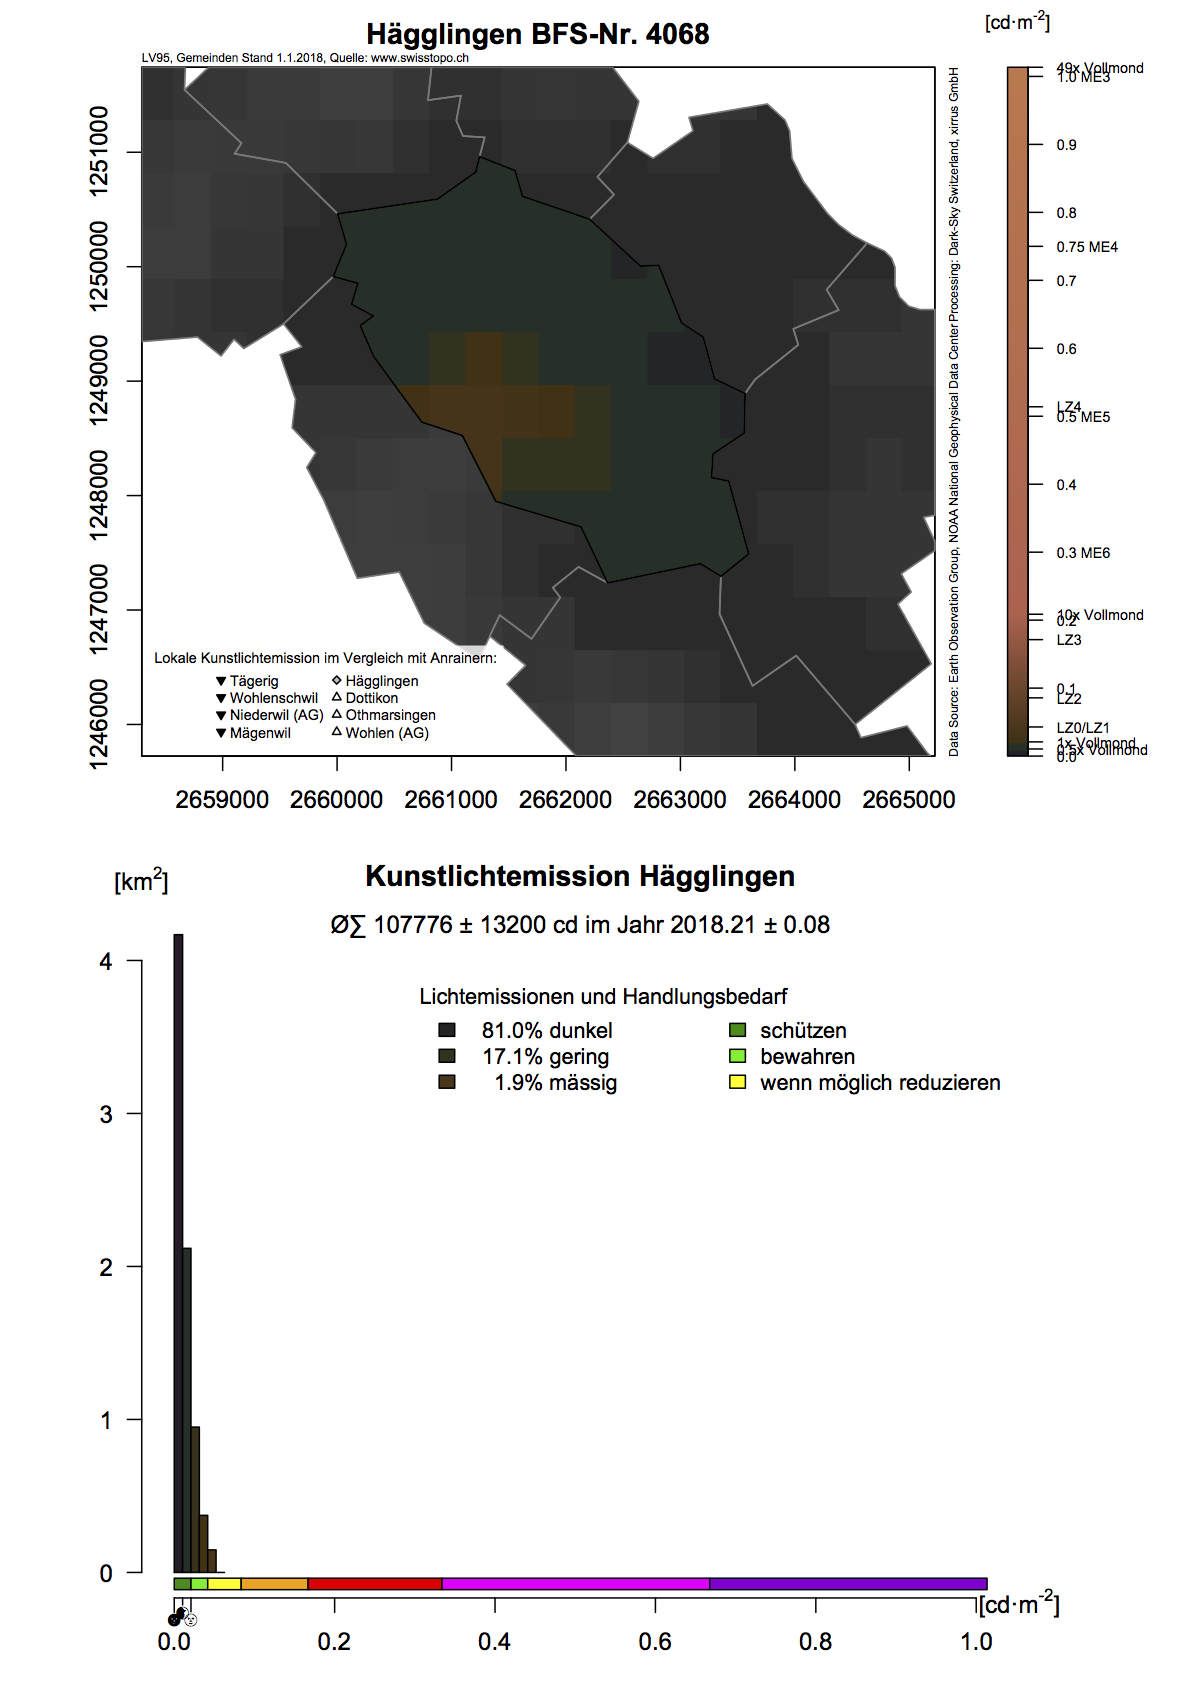
The bar chart shows the area sizes per illumination level. The colour gamut green-red-purple translates to actions protect-watch-reduce.
Interpretation and Suggestions for Action
Emissions in Hägglingen are comparable to the neighbouring municipalities. Natural areas are not overly impacted, with nightly darkness still exceeding 80 % of the theoretical maximum. The brightest spots, in the south west of the municipal area, reach up to three times the illumination of the full moon, and join seamslessly the light of Dottikon (south-west), which is even brighter. Teaming up with Dottikon for a lighting-reducing strategy might be a good idea.Further potential actions include:
- Consider switching off street lighting completely from midnight to 5 o'clock
- Switch off illuminated advertisements during night-time
- Smart illumination: Sensors turn up a dim lighting on demand
- Shield lamps to illuminate the required patches only
Trend from April 2012 to May 2018
 This graph shows the total of light emissions of the municipality
by month, from the beginning of operation of the satellite. The
unit is kilo-candela, a thousandfold of a candela, which is
approximately the light emmitted by a candle flame.
The winter months with snow and without fog are usually the
brightest, as much light is reflected from the ground. Despite the
high variation per season, due to weather and vegetation (shading
by foliage, dry or covered ground), a clear overall upward trend
is apparent.
Such an increase in light emissions is usually due to population
growth and additional lightings, which is driven by both
residents and industry.
This graph shows the total of light emissions of the municipality
by month, from the beginning of operation of the satellite. The
unit is kilo-candela, a thousandfold of a candela, which is
approximately the light emmitted by a candle flame.
The winter months with snow and without fog are usually the
brightest, as much light is reflected from the ground. Despite the
high variation per season, due to weather and vegetation (shading
by foliage, dry or covered ground), a clear overall upward trend
is apparent.
Such an increase in light emissions is usually due to population
growth and additional lightings, which is driven by both
residents and industry.
Localized Trends in the Range 2014 to 2017
This maps shows the localized changes: red parts indicate an increase, green parts a decrease of emitted light. The municipalilty of interest is in the centre with stroked borders, surrounded by its neighbours for comparison.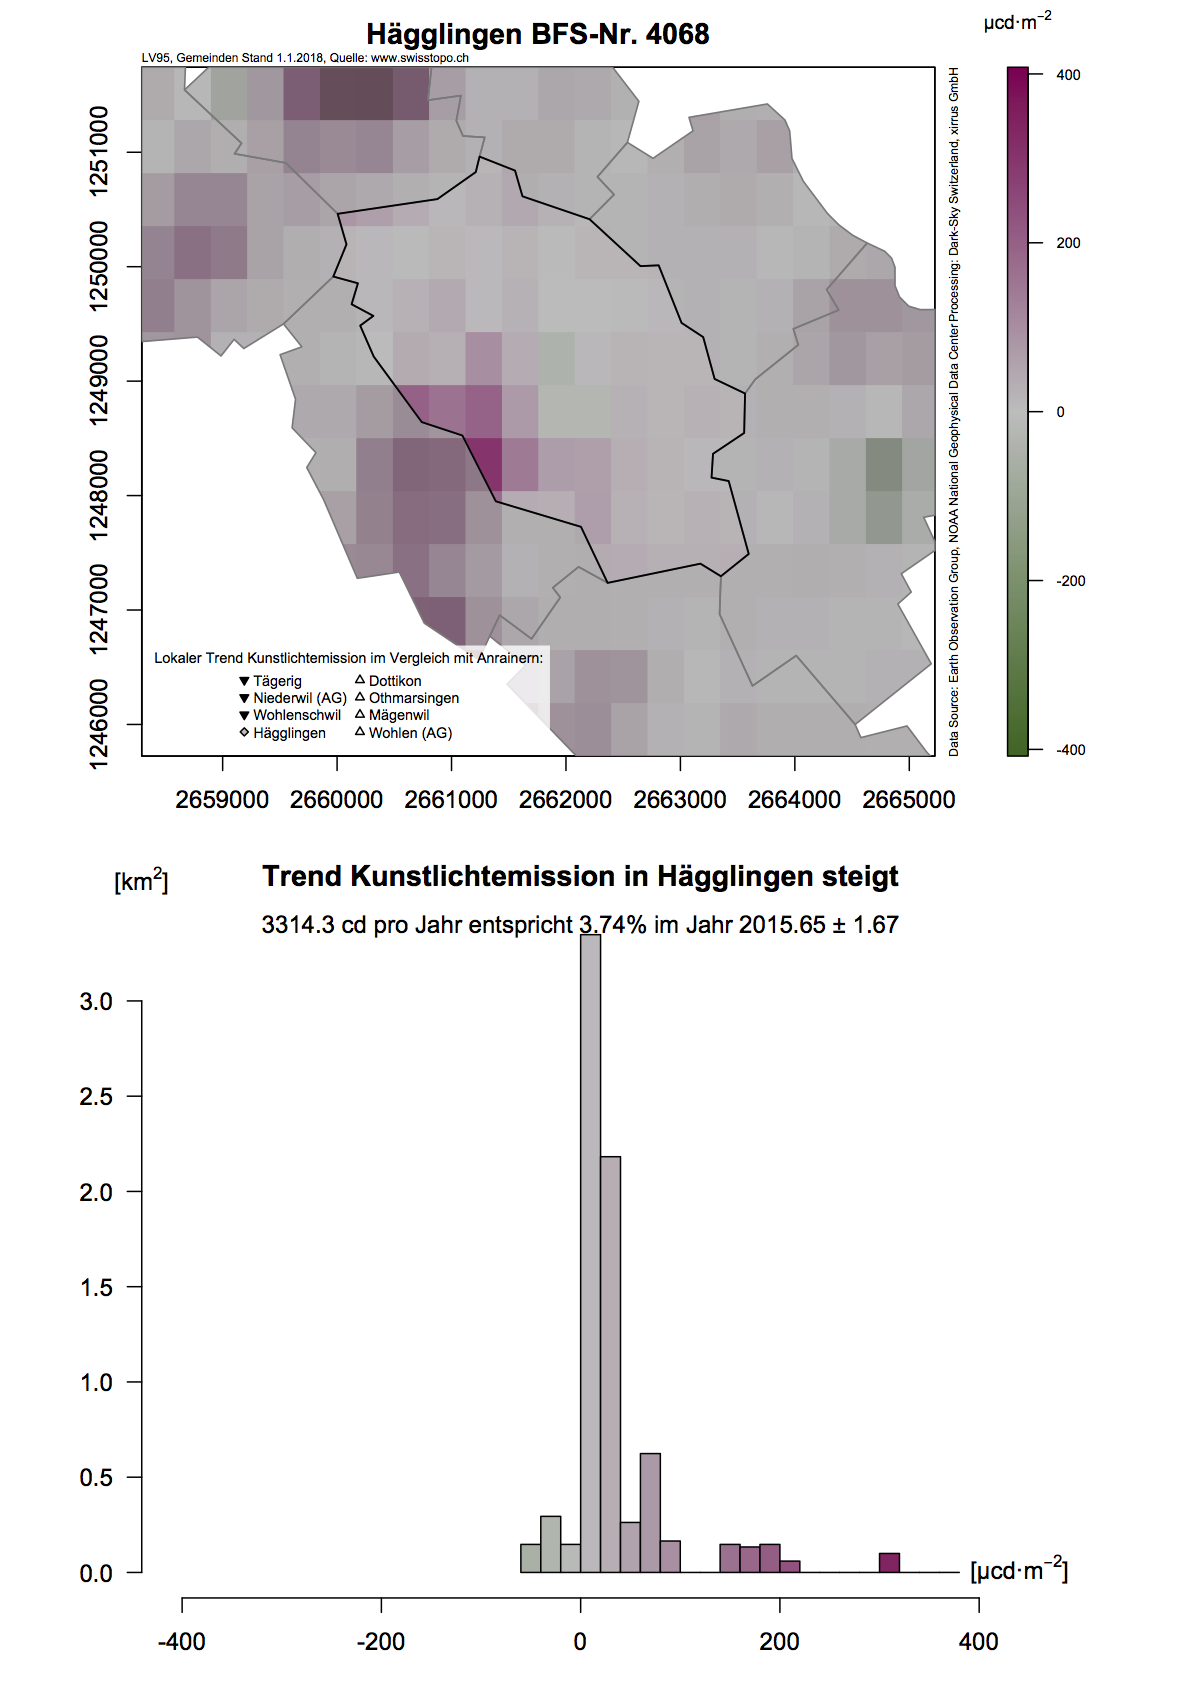 The bar chart shows the area by change amount (height of the bars). Greenish—to the
left, is reduction; reddish—to the right is increase.
The bar chart shows the area by change amount (height of the bars). Greenish—to the
left, is reduction; reddish—to the right is increase.
Interpretation
In Hägglingen, a clear increase in light emissions is located near the soccer ground. However, as the satellite measuring slot is usually after finishing the game, we rather suspect nearby greenhouses to be the reason, which use night-time illumination to stimuate growth or ripening. In such a case, shielding the greenhouses to avoid emergent light by special blinds could be a solution. In the Netherlands, home of many growhouses, such blinds are compulsory.In general, an increase in light emission in settlement areas are common, which is usually due to the replacement of lamps by more efficient variants, which mostly are brighter and still saving power.
The reason for the reduction near Eichgasse is hard to tell from afar. Refurbishment of lighting, or growing trees, could be an explanation.
Conclusion
The reported trends are meaningful to local authorities, who know the local issues. Comparison to neighbours is often an effective driver for improvement. Similar to the "Energiestadt" label, such a baseline study points out awareness, meaningful improvements and practical actions, which serves both residents and environment.References
We applied the presented methods for:Swiss Cantons: Solothurn, St. Gallen
Swiss Municipalities: City of Winterthur, Sargans, Aeugst am Albis, Hausen am Albis, Langnau am Albis, Volketswil, Hünenberg
International: Luxembourg, City of Luxemburg, Naturpark Our in Luxembourg
| Feedback |