| Offers: Light and Darkness · Simulation · Software · Company · Contact |
 | |

| |
Simulation of congestion
A traffic jam is a more gentle mode of a rear-end-collision.
While discussing congestion, one immediately thinks of traffic jams, which is correct - however the phenomenon is not at all limited to roads and highways.
Congestion occurs to various objects moving in confined rooms, as some examples show:
| dimension | object | confined room | bottleneck | consequence |
| macroscopic | cars | roads, highways | lane blocking | slow-down, deadlock |
| multi-story car park | high load | clogging | ||
| airplanes | holding area (air) | holding pattern | delay | |
| departure area (ground) | queueing | delay | ||
| pedestrians | waiting rooms | queueing | delay | |
| microscopic | red blood cells | bloodstream | constricted vessel | clogging |
| molecular | molecules | container wall | collisions | pressure |
| digital electronics | data packet | communications network | queueing | delay |
If the local density of particles has exceeded a certain extent and the density
is not reduced in time, its consequence will grow furthermore. For all particles
concerned the velocity decreases.
The reason is a bottleneck in the confined room or a particle has become an
obstacle by its own delay.
The situation of "rien ne va plus" is highly undesirable, but it will happen
precisely if a congestion has grown too far, movement will be freezed.
By chance, the individual particle concerned cannot recognise its situation completely.
Everything seems blocked and stands still. When it will be able to "move again" nobody
knows - except the first particle which will be able to move freely again.
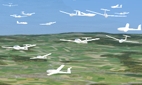
An external observer (e.g. in a helicopter monitoring the traffic jams) will see, where
the congestion begins and how far it is distributed at times. From above he can judge
the situation and estimate the delay that will result for individuals.
With simulation, we feel a bit like in the helicopter. We can better observe and find out.
In the molecular world we find an analogy in the table above: Although molecules are confined in a room, they do not queue, but move thermodynamically and may collide fiercely and as a consequence, pressure builds up.
The delay due to another particle or different obstable in a jam therefore is comparable to a gentle mode of collision.
Or claimed more precisely:
- A traffic jam on a highway is a more gentle mode of a rear-end-collision.
- Stagnant traffic lanes are in a gentle mode of a traffic jam.
Let's move on to the digital dimension: congestion in the world of communication.
| |
| |
Radio network traffic simulations
We have investigated congestion (message jams) in a mobile peer-to-peer communication network because of its relevant safety impact. The network considered supplies timely warnings through the successful transceiver Flarm to avoid collisions with private airplanes (gliders mainly).The simulated load curve shows the limitation of this system: Of the total number of messages that are theoretically receivable only a fraction successfully transmits through the system, depending on its total load.
Increase and decay of average successful communication in a peer to peer network
Firstly, with the increasing number of participating and geometrically readable transmitters per transceiver (red curve), the number of receivable messages augments proportionally. Only after a certain density of the radio network is reached, the transmission capacity is at its maximum, and after that is further decreased due to congestion (blue curve).
The specific feature of this network is, that each additional node contributes an additional load, since each node sends its flight path prediction over and over again to all neighbouring airplanes. In contradiction to any statical network, the nodes are moving and the number of messages augments nearly quadratic with the number of nodes n*(n-1).
The capacity limit results from the limited overall available time frame and the duration of each message. Firstly, the total number of messages is therefore limited and secondly, overlapping messages cannot be understood and have to be repeated with a delay.
The maximum capacity limit is reached, when each node is in contact with 25 neighbors. For the safety of air traffic this is a good value.
Read more in the detailed article about "Simulations for enhancing of the FLARM communication protocol" (PDF download 0.67 MB) of the journal segelfliegen from May/June 2008.
In the mentioned network the nodes are moving all the time, i.e. the network geometry is changing every second, but the number of data packets and the data stream per node is nearly a constant.
| |

| |
Line network traffic simulations
In a static, e.g. computer network only the data packets are moving and the network topology is fixed most of the time (except for mobile devices), but on the other hand load is changing all the time by the users and servers activities.The capacity limits are depending on the data transfer rates and the routing policy of each node. How can load be balanced such as delay times are kept low?
Naturally, this research topic is keeping the world busy since networks exist.
Whereas for small networks a precise modelling of all components is still possible,
very large networks can be successfully abstracted into simpler models, such that
the errors in comparison to measurements are kept small and the big picture can
be estimated by limited computer power.
Nowadays we are depending on all kinds of networks. Power grids, line telephone networks, mobile phone networks, cable networks, internet connections globally, regionally, and locally, down to a wireless local area net in your office.
The lines, the nodes and the routing-rules are different in each case, but the congestion problems are comparable in their effect and always undesireable.
At this point we at xirrus simulation provide you a possibility to analyse, understand and optimise your congestion problems, e.g. for your communication or computer network.
We like to hear about your considerations.
Dr. Lukas Schuler
Director
xirrus GmbH
Dr. Lukas Schuler is scientist and owner of a didactic certificate of ETH Zürich. He simulated various lipid aggregates on a molecular level and significantly improved the available molecular model. He had four years of experience with internet and web development as a co-founder of xirrus GmbH, before the company was focussed mainly on computer simulation services.
Replication allowed only with written agreement by xirrus
| Feedback |